🧬 Introduction
In forensic genetics, Short Tandem Repeats (STRs) have been the key of human identification for over two decades.
Current forensic systems typically use 24 autosomal STR markers, forming the global standard for paternity testing, missing person identification (MPI) and disaster victim identification (DVI).
However, the field is now gradually migrating toward high-density Single Nucleotide Polymorphism (SNP) technologies.
This transition is motivated by the need for greater statistical resolution, improved ability to detect distant kinship, and compatibility with degraded DNA samples often recovered in humanitarian and forensic contexts.
⚖️ Likelihood Ratios in Forensic Inference
The foundation of modern forensic kinship evaluation is Bayesian statistical inference, where evidence is interpreted by comparing how well different biological scenarios explain the observed DNA data.
In this framework, the central quantity is the Likelihood Ratio (LR)
$$ LR = \frac{P(\text{Genetic data} \mid H_1)}{P(\text{Genetic data} \mid H_2)} $$
where:
- $H_1$: the hypothesis that the tested individuals are biologically related,
- $H_2$: the hypothesis that they are unrelated.
An LR greater than 1 supports relatedness, while values below 1 support non-relatedness.
🧪 Hypotheses in a Missing Person Identification (MPI) case
In missing person investigations we rarely have a DNA profile from the missing person (MP) itself.
Instead, we collect DNA from biological relatives (parents, siblings, aunts/uncles, grandparents) and compare those profiles with a person of interest (POI).
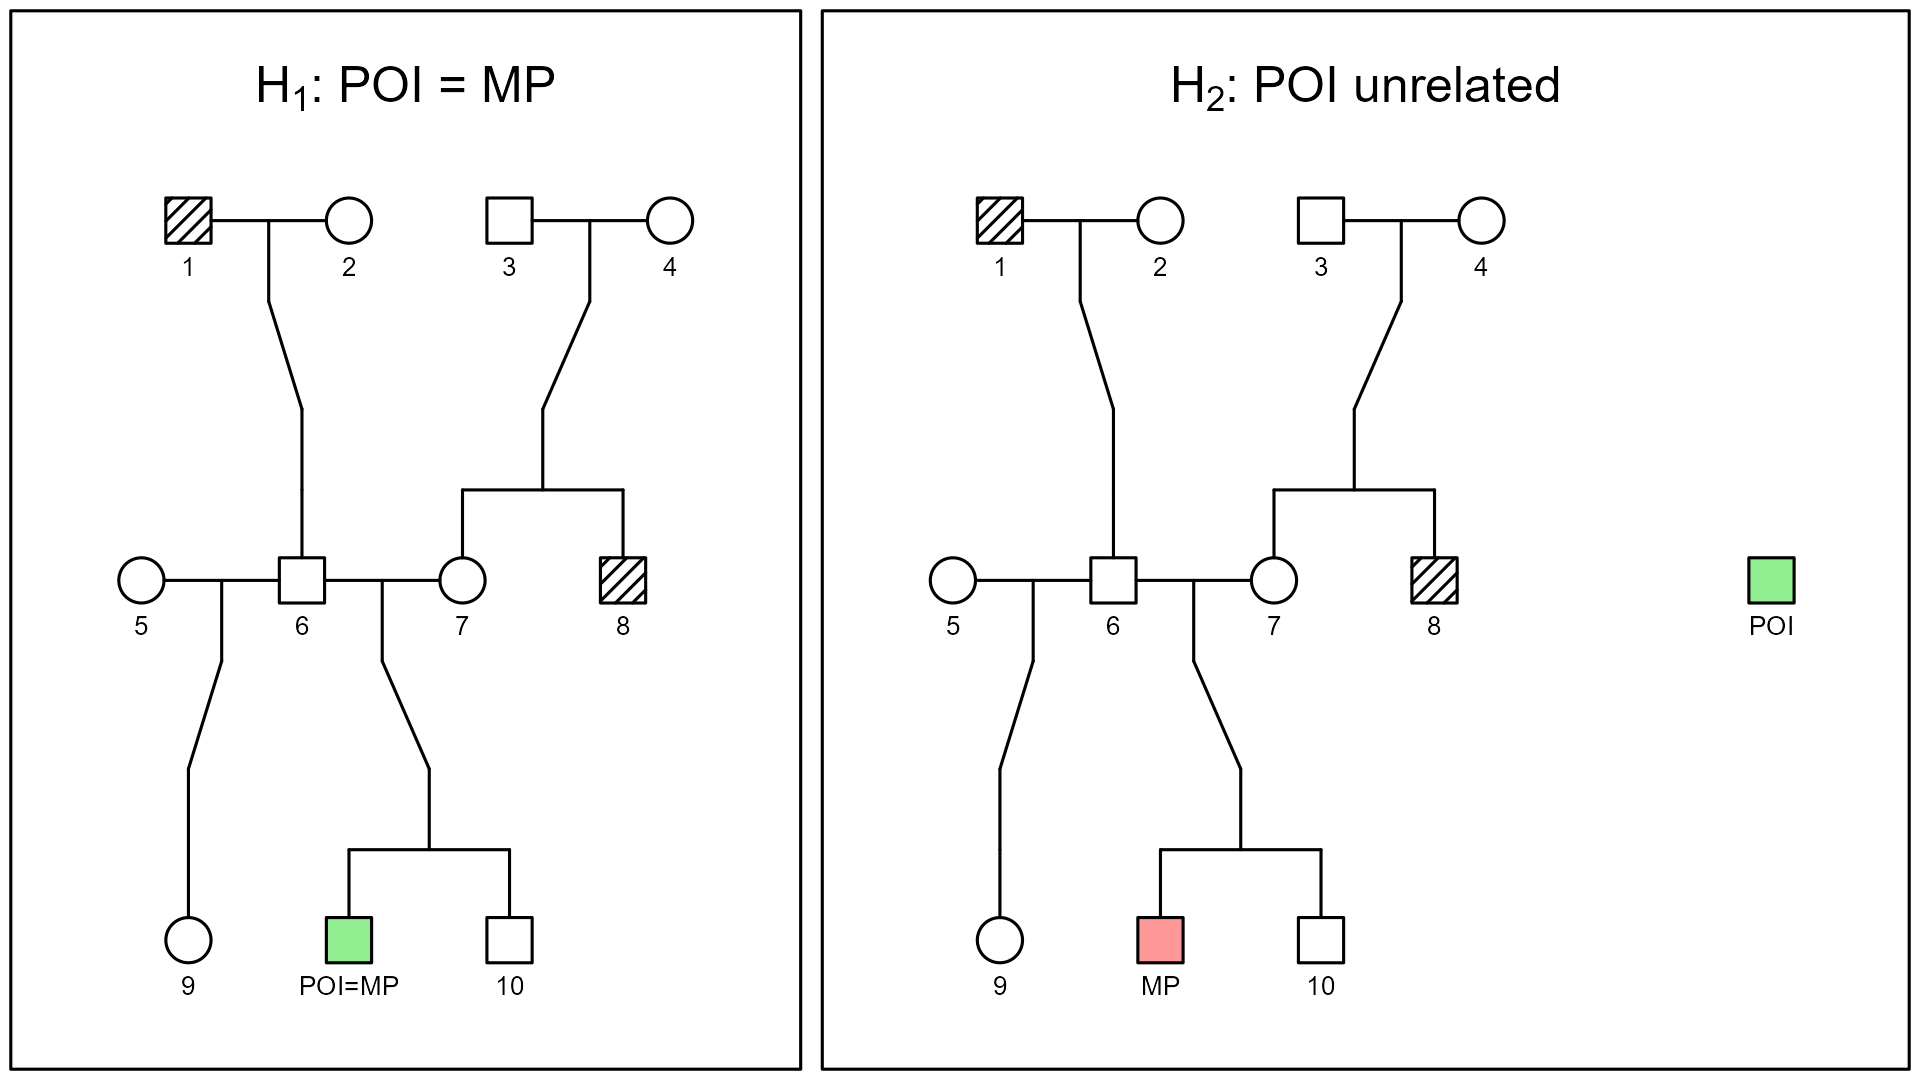
The figure below illustrates the two competing hypotheses that underlie the LR:
$H_1$: POI = MP
The POI is assumed to occupy the missing person’s position in the pedigree.
The green square is both POI and MP, and the LR numerator is the probability of observing the relatives’ genotypes if the POI truly belongs in that family.$H_2$: POI is unrelated
The MP still belongs in the pedigree, but the POI is now placed outside the family, as an unrelated individual from the reference population.
The denominator of the LR is the probability of the same genetic data if the POI is just a random, unrelated person.
The LR summarizes how much more (or less) compatible the observed DNA is with the POI = MP scenario than with the POI unrelated scenario.
This pedigree allows the same set of typed individuals to be interpreted under different hypotheses-such as related versus unrelated-by changing only the biological connections between them.
To help interpret the diagrams, note that forensic pedigrees follow standard genetic notation:
- Squares represent males, and circles represent females.
- Unfilled symbols denote individuals without genetic data, whereas hatched or colored symbols indicate those who are genotyped or specifically highlighted in the analysis (e.g., the MP or typed reference relatives).
- Horizontal lines connect biological parents, and vertical lines descend from parents to their children.
- When multiple siblings are present, they share a single vertical line that branches horizontally.
- Generations are arranged from top to bottom, with older generations above and descendants below.
🎲 STR Kinship Simulations and Statistical Power
To understand how well traditional STR markers perform in kinship inference, we can simulate thousands of conditioned profiles and calculate $\log_{10}(LR)$ under both hypotheses:
- Related (H1) - the POI truly belongs in the family.
- Unrelated (H2) - the POI is a random individual from the population.
Pedigree: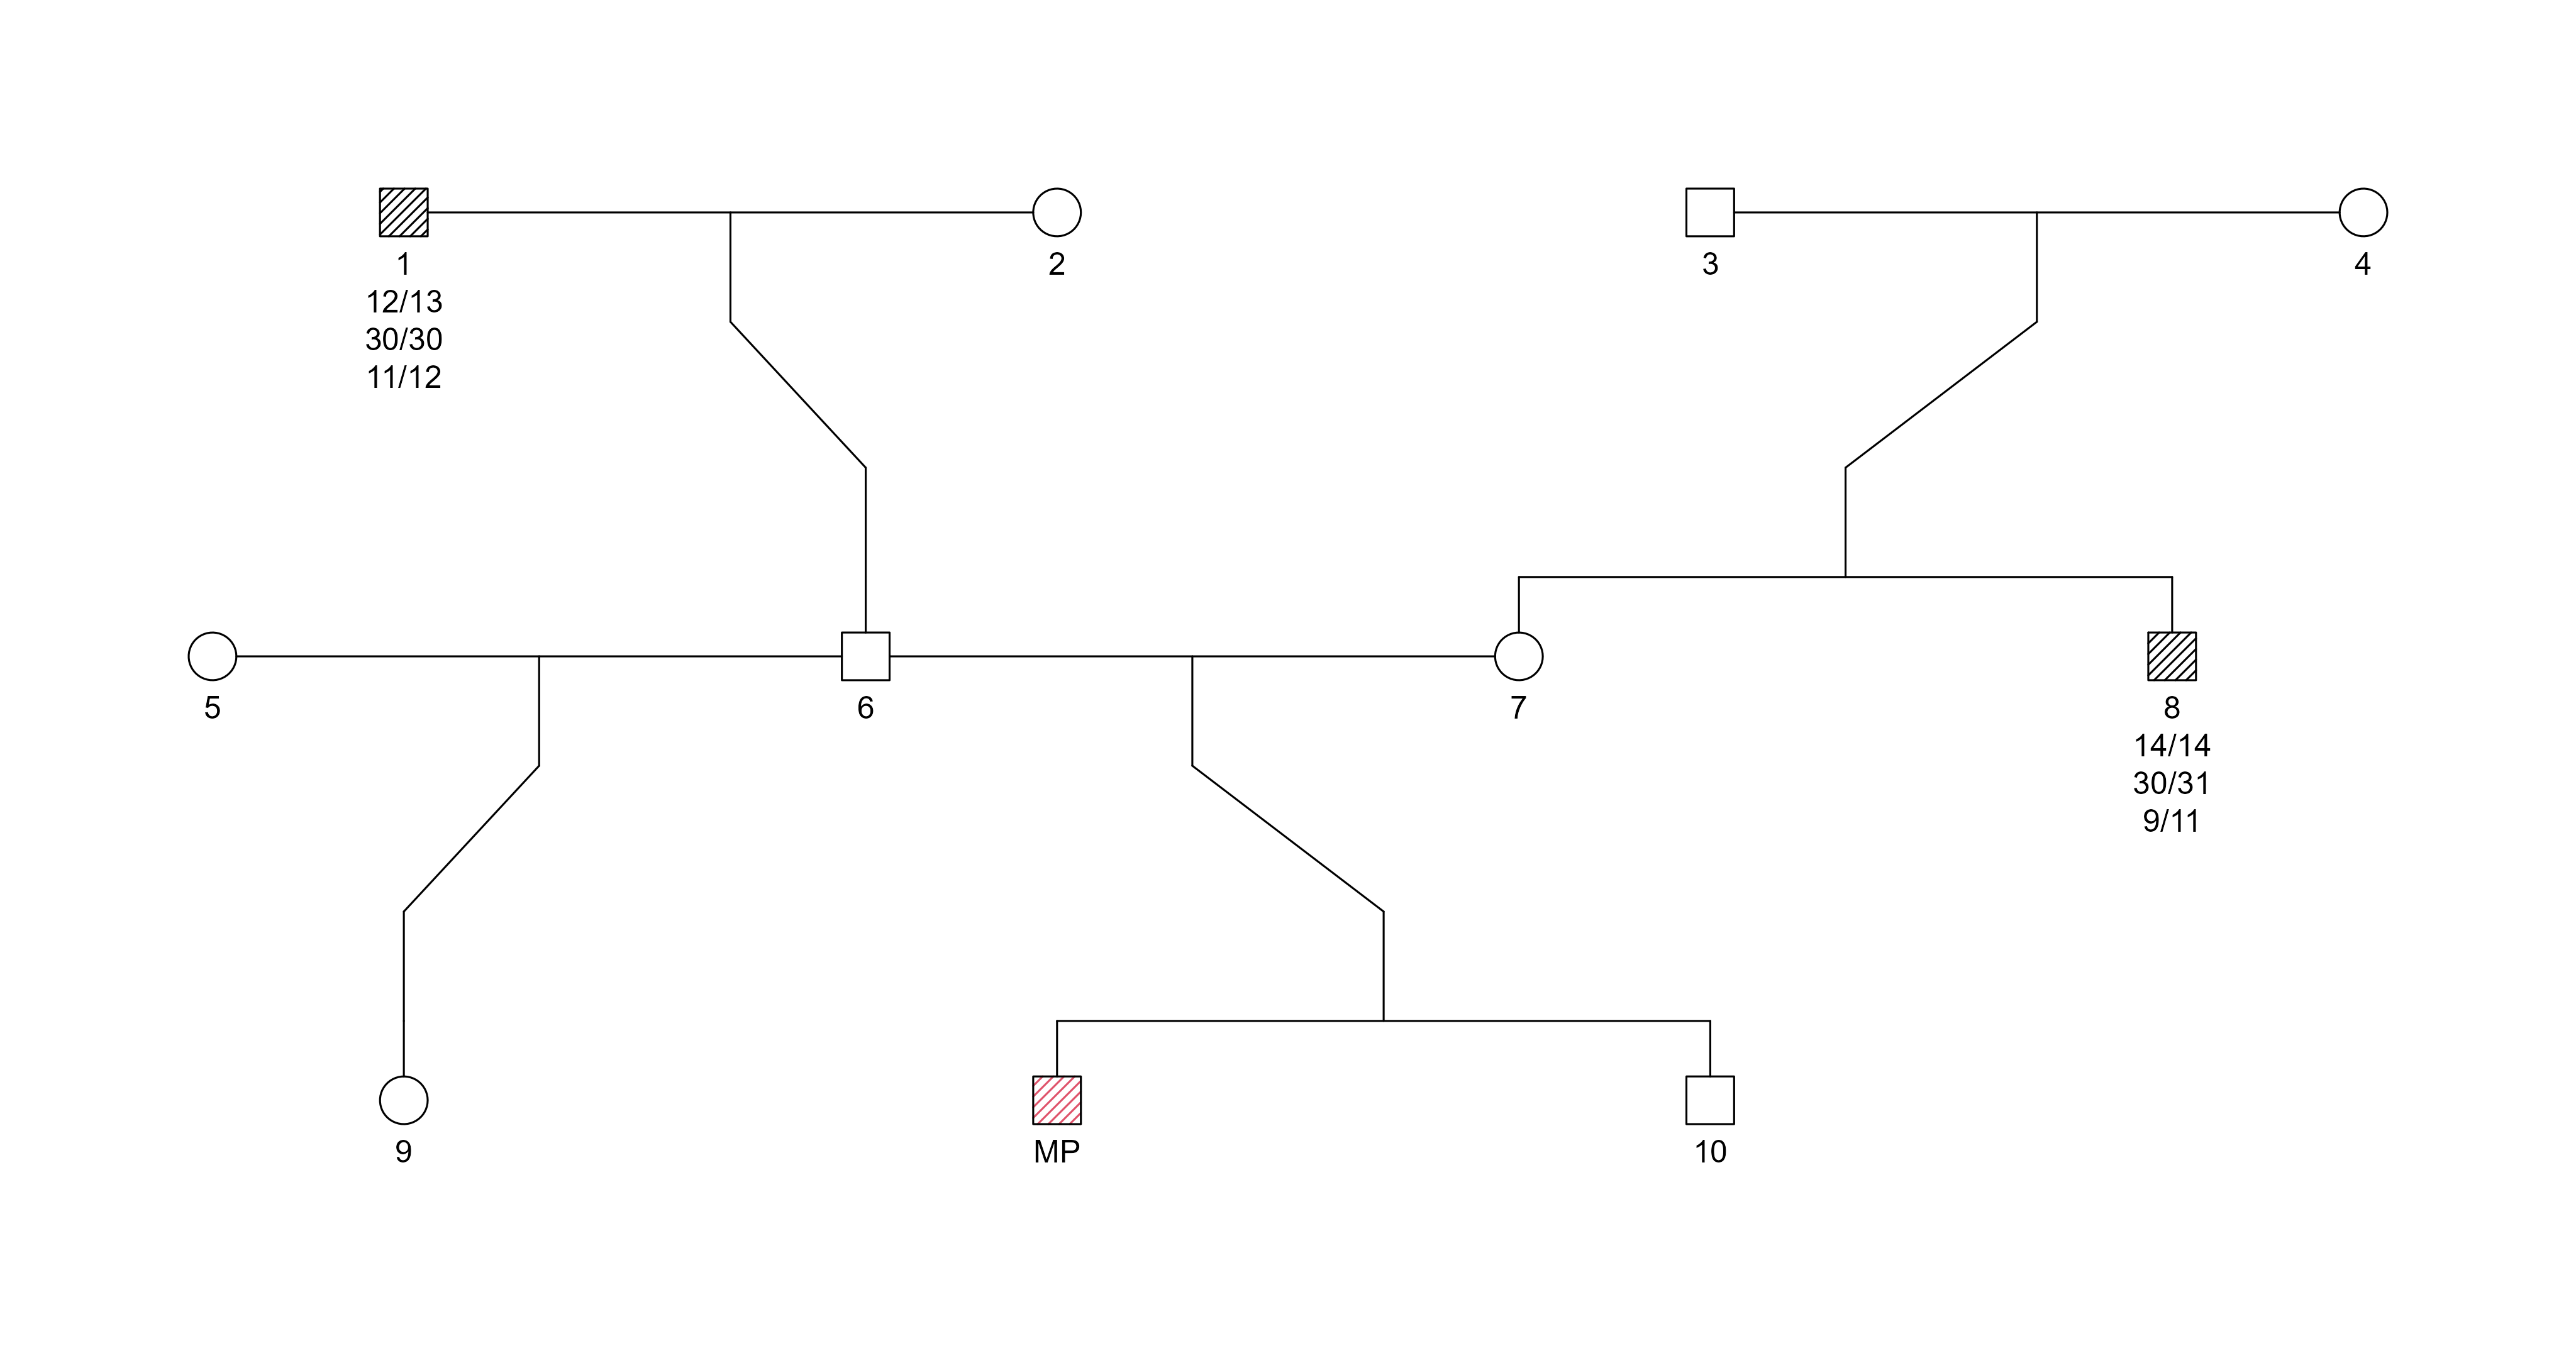
Example trio pedigree for STR-based kinship testing. The Missing Person (MP) and both relatives are genotyped at 24 autosomal STR markers.
The interactive figure below displays the resulting probability density curves for each scenario.
The red distribution corresponds to Unrelated cases, while the blue distribution corresponds to Related cases.
Vertical dashed lines mark the mean $\log_{10}(LR)$ and the short vertical blue and red bars on the x-axis indicate the
minimum and maximum observed values for each distribution.
LR distributions:
Interactive LR distributions derived from kinship simulations using forrel and the 24 STR markers; visualization created with Plotly in R.
Because STR panels contain a limited number of markers, the two distributions show a substantial overlap.
This overlap creates regions where:
- False positives occur (unrelated individuals with LR ≥ 1), and
- False negatives occur (related individuals with LR < 1).
These regions are highlighted in the interactive plot. They represent outcomes where the statistical evidence would point in the wrong direction - a critical limitation when dealing with missing-person cases or distant relatives.
Although STRs are powerful for close relationships, their discriminative ability declines significantly as biological distance increases, motivating the transition toward high-density SNP panels.
🔍 How SNPs Enhance the Statistical Power of Kinship Inference
SNP-based panels address many of the intrinsic limitations of STR markers.
While STRs are informative but limited in number, Single Nucleotide Polymorphisms (SNPs) are extremely abundant, allowing the construction of panels with thousands of loci distributed across the genome.
A major methodological advantage is that SNP-based likelihood ratio models can explicitly incorporate linkage and linkage disequilibrium (LD).
This means that nearby markers are not assumed to be independent, and the LR calculation can correctly account for the inheritance of shared genomic segments.
This is particularly important when working with dense panels where many SNPs fall within the same haplotype block.
The FORCE panel, for example, contains 3,915 autosomal SNPs designed to maximize kinship resolution up to the 5th degree of relationship.
Because SNPs capture segment sharing and recombination patterns with high resolution, they markedly improve discriminatory power, even for distant or weak biological relationships.
📊 SNP LR Distributions Across Degrees of Relatedness
To demonstrate the practical impact of SNPs on kinship resolution, we simulated duo comparisons between a Missing Person (MP) and one relative at a time, separately for five degrees of biological relatedness.
For every scenario, we computed the $\log_{10}(Linked LR)$ distributions assuming both Related and Unrelated hypotheses, using a likelihood framework that explicitly models marker linkage-a crucial requirement when working with highly dense SNP panels such as FORCE (3915 SNPs).
Each degree of relationship is represented by a specific pedigree plot, followed by the corresponding LR density curves, illustrating how the separation between hypotheses evolves as the amount of shared DNA decreases.
👨👦 1° Degree – Parent–child / Full siblings
Pedigree: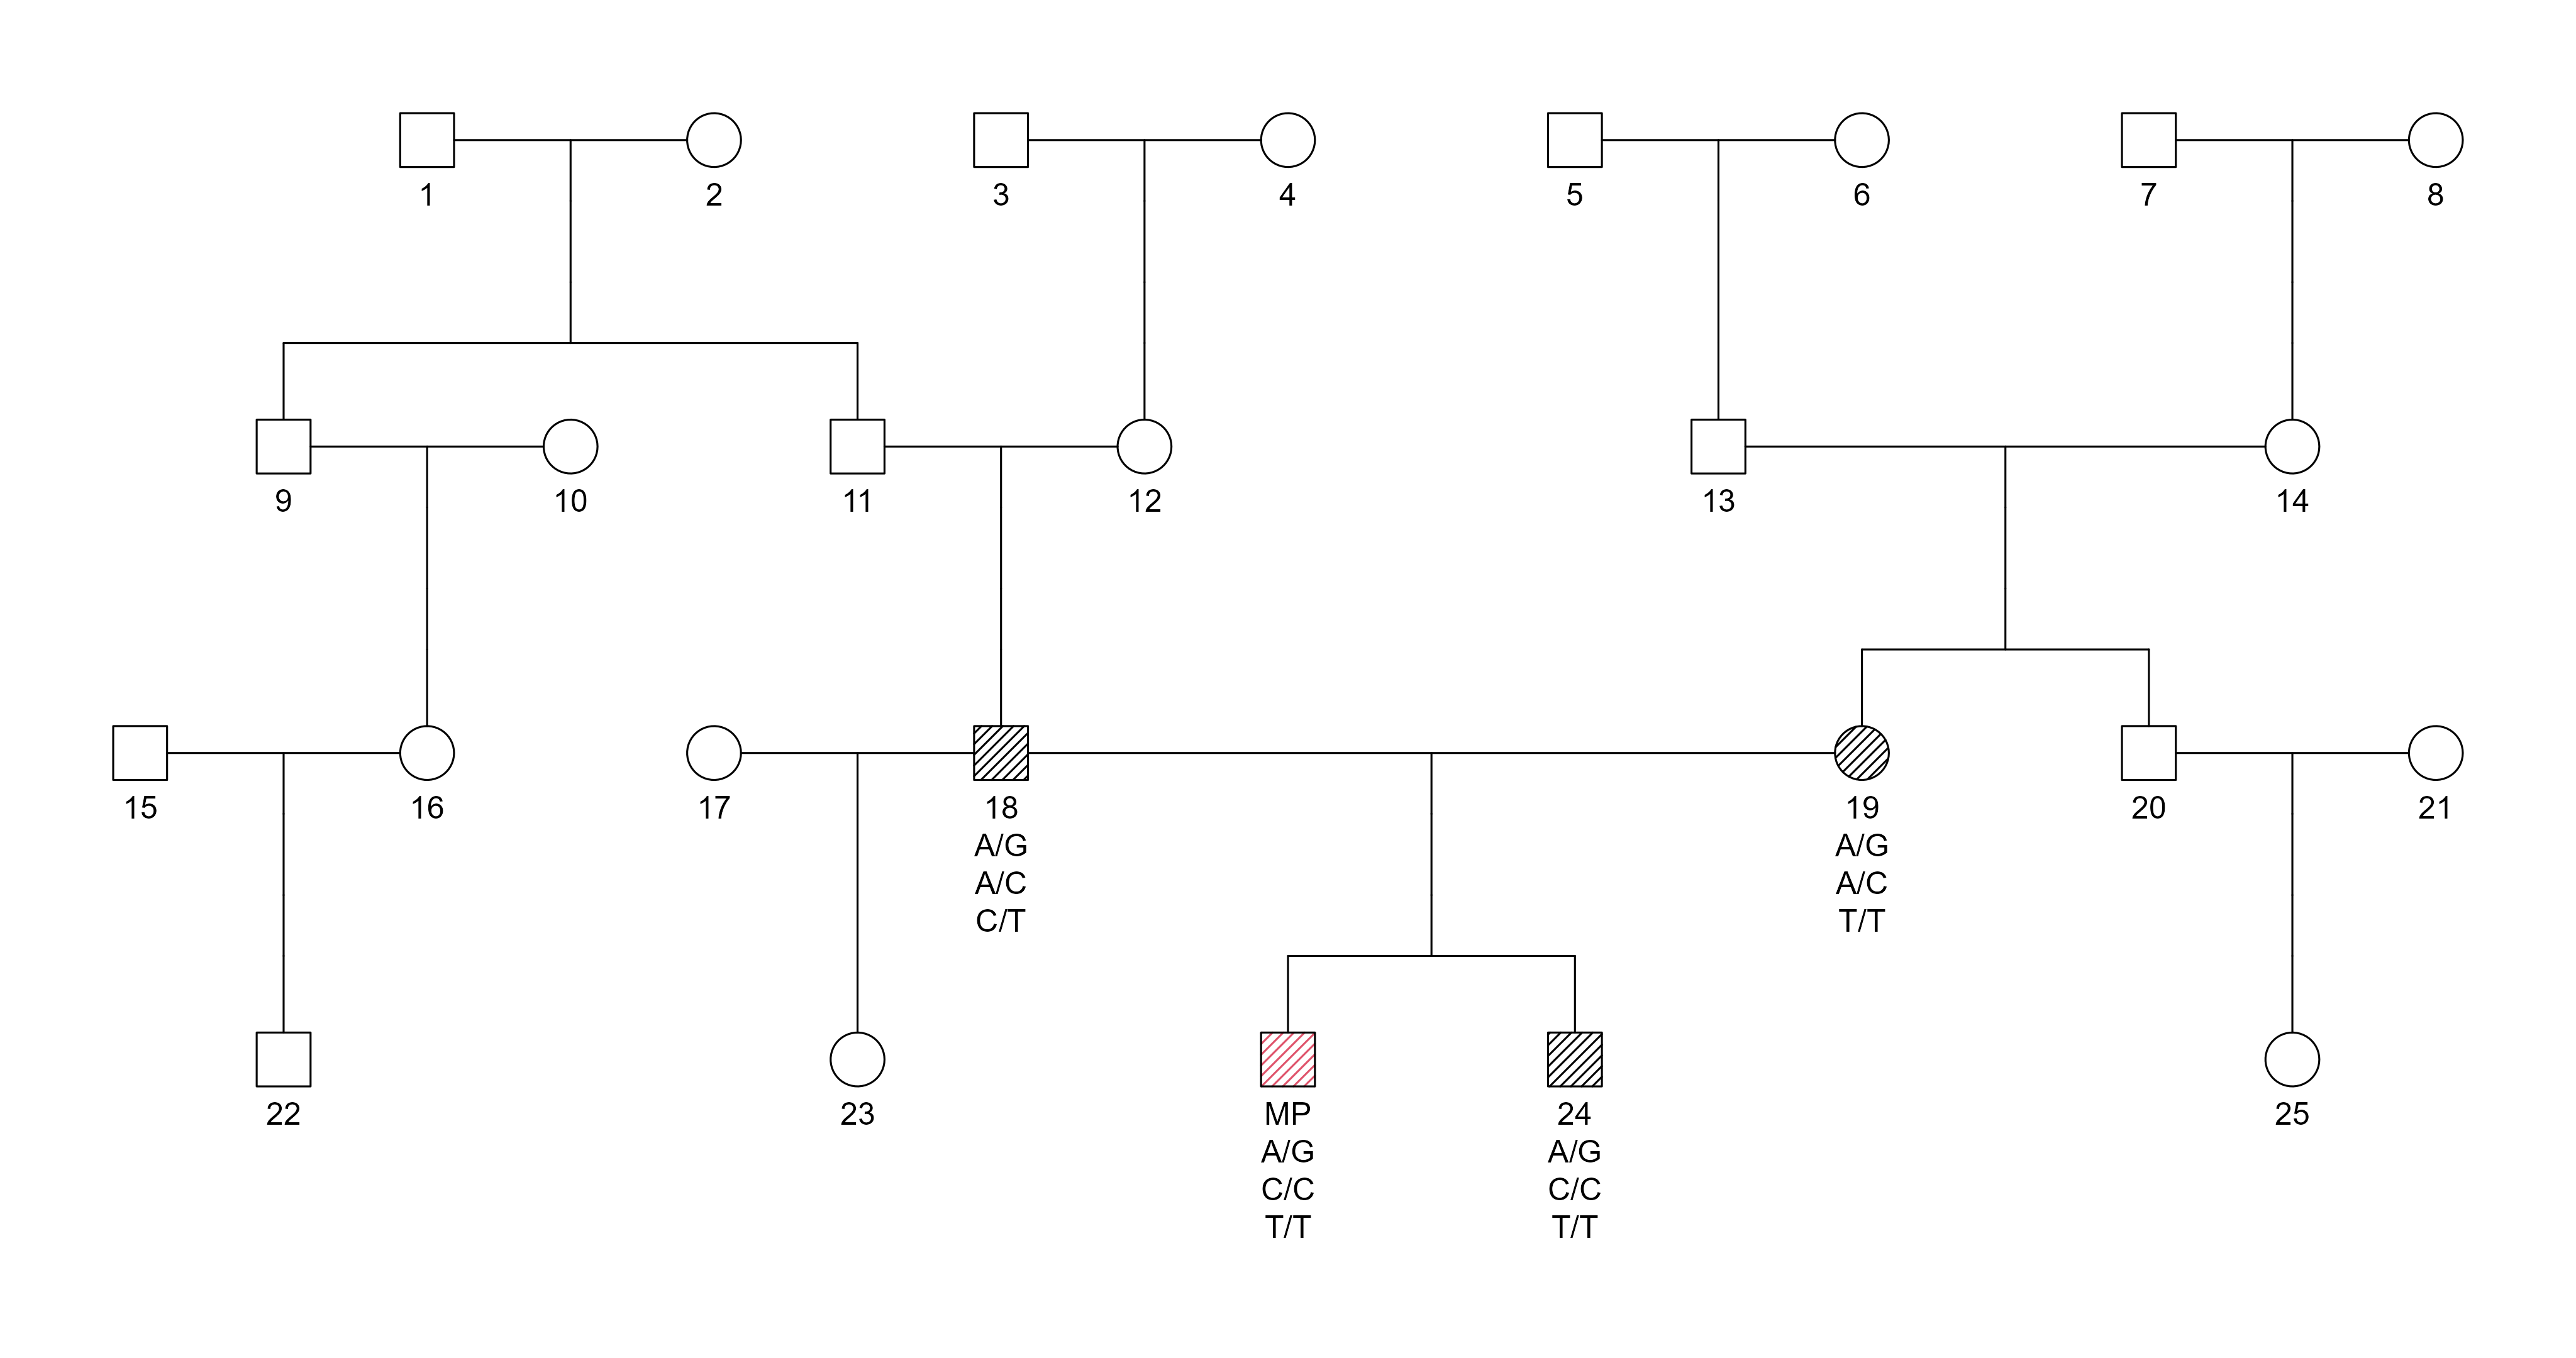
Pedigree structure for SNP-based duo testing at the 1st degree of relatedness. The Missing Person (MP) and the close relative (parent–child or full sibling)
LR distributions:
Interactive LR curves generated from duo kinship simulations using the FORCE 3,915 markers SNP panel . Linked LR computed with Merlin and visualization rendered with Plotly in R.
At first degree, SNPs provide extremely strong discrimination.
The Related distribution lies entirely on the positive side of the LR axis (with very high values), while the Unrelated distribution collapses near $\log_{10}(LR) = -308$, producing absolute separation.
False positives or false negatives are essentially nonexistent.
👨👩👦 2° Degree – Grandparent–grandchild / Avuncular / Half-Siblings
Pedigree: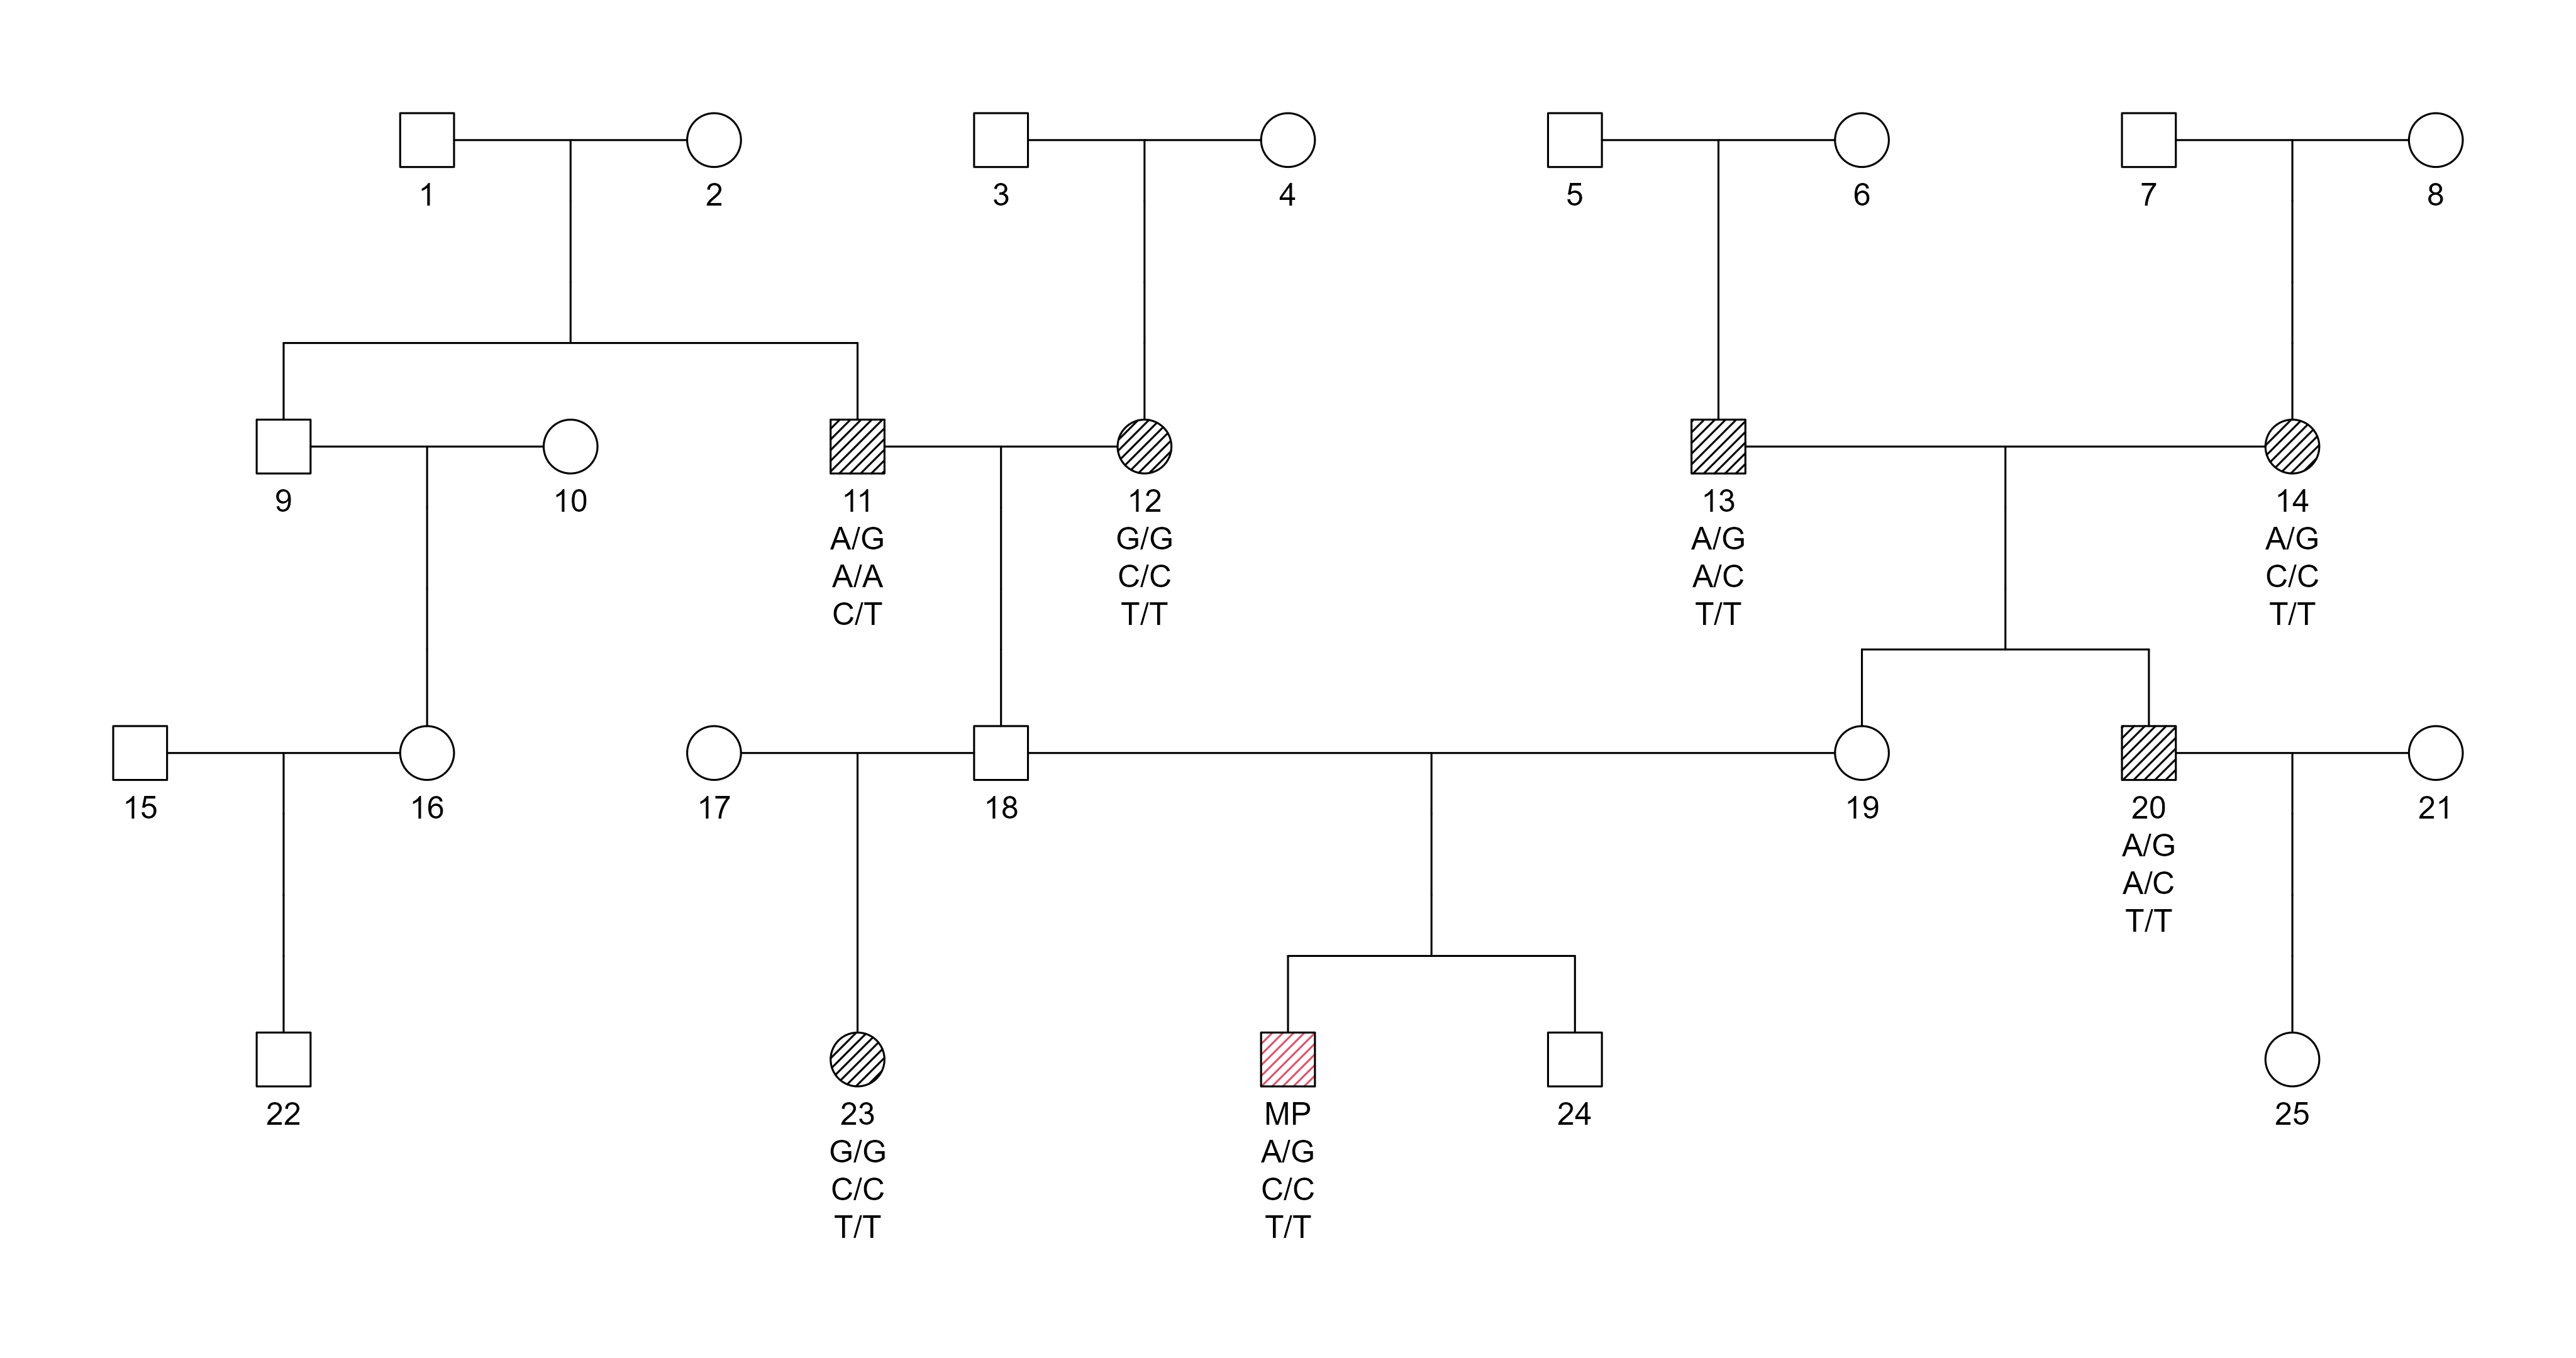
Pedigree structure for SNP-based duo testing at the 2nd degree of relatedness. The MP is compared to a grandparent, avuncular relative, or half sibling.
LR distributions:
Interactive LR curves generated from duo kinship simulations using the FORCE 3,915 markers SNP panel . Linked LR computed with Merlin and visualization rendered with Plotly in R.
Second-degree comparisons still show excellent separation.
The Related curve remains clearly to the right of the threshold, with high LR values, whereas the Unrelated distribution remains tightly concentrated near strongly negative values.
Even with duo testing, the distance between the two distributions continues to be large.
👨👧👦 3° Degree – Great-grandparent / Grand-Avuncular / First cousins
Pedigree: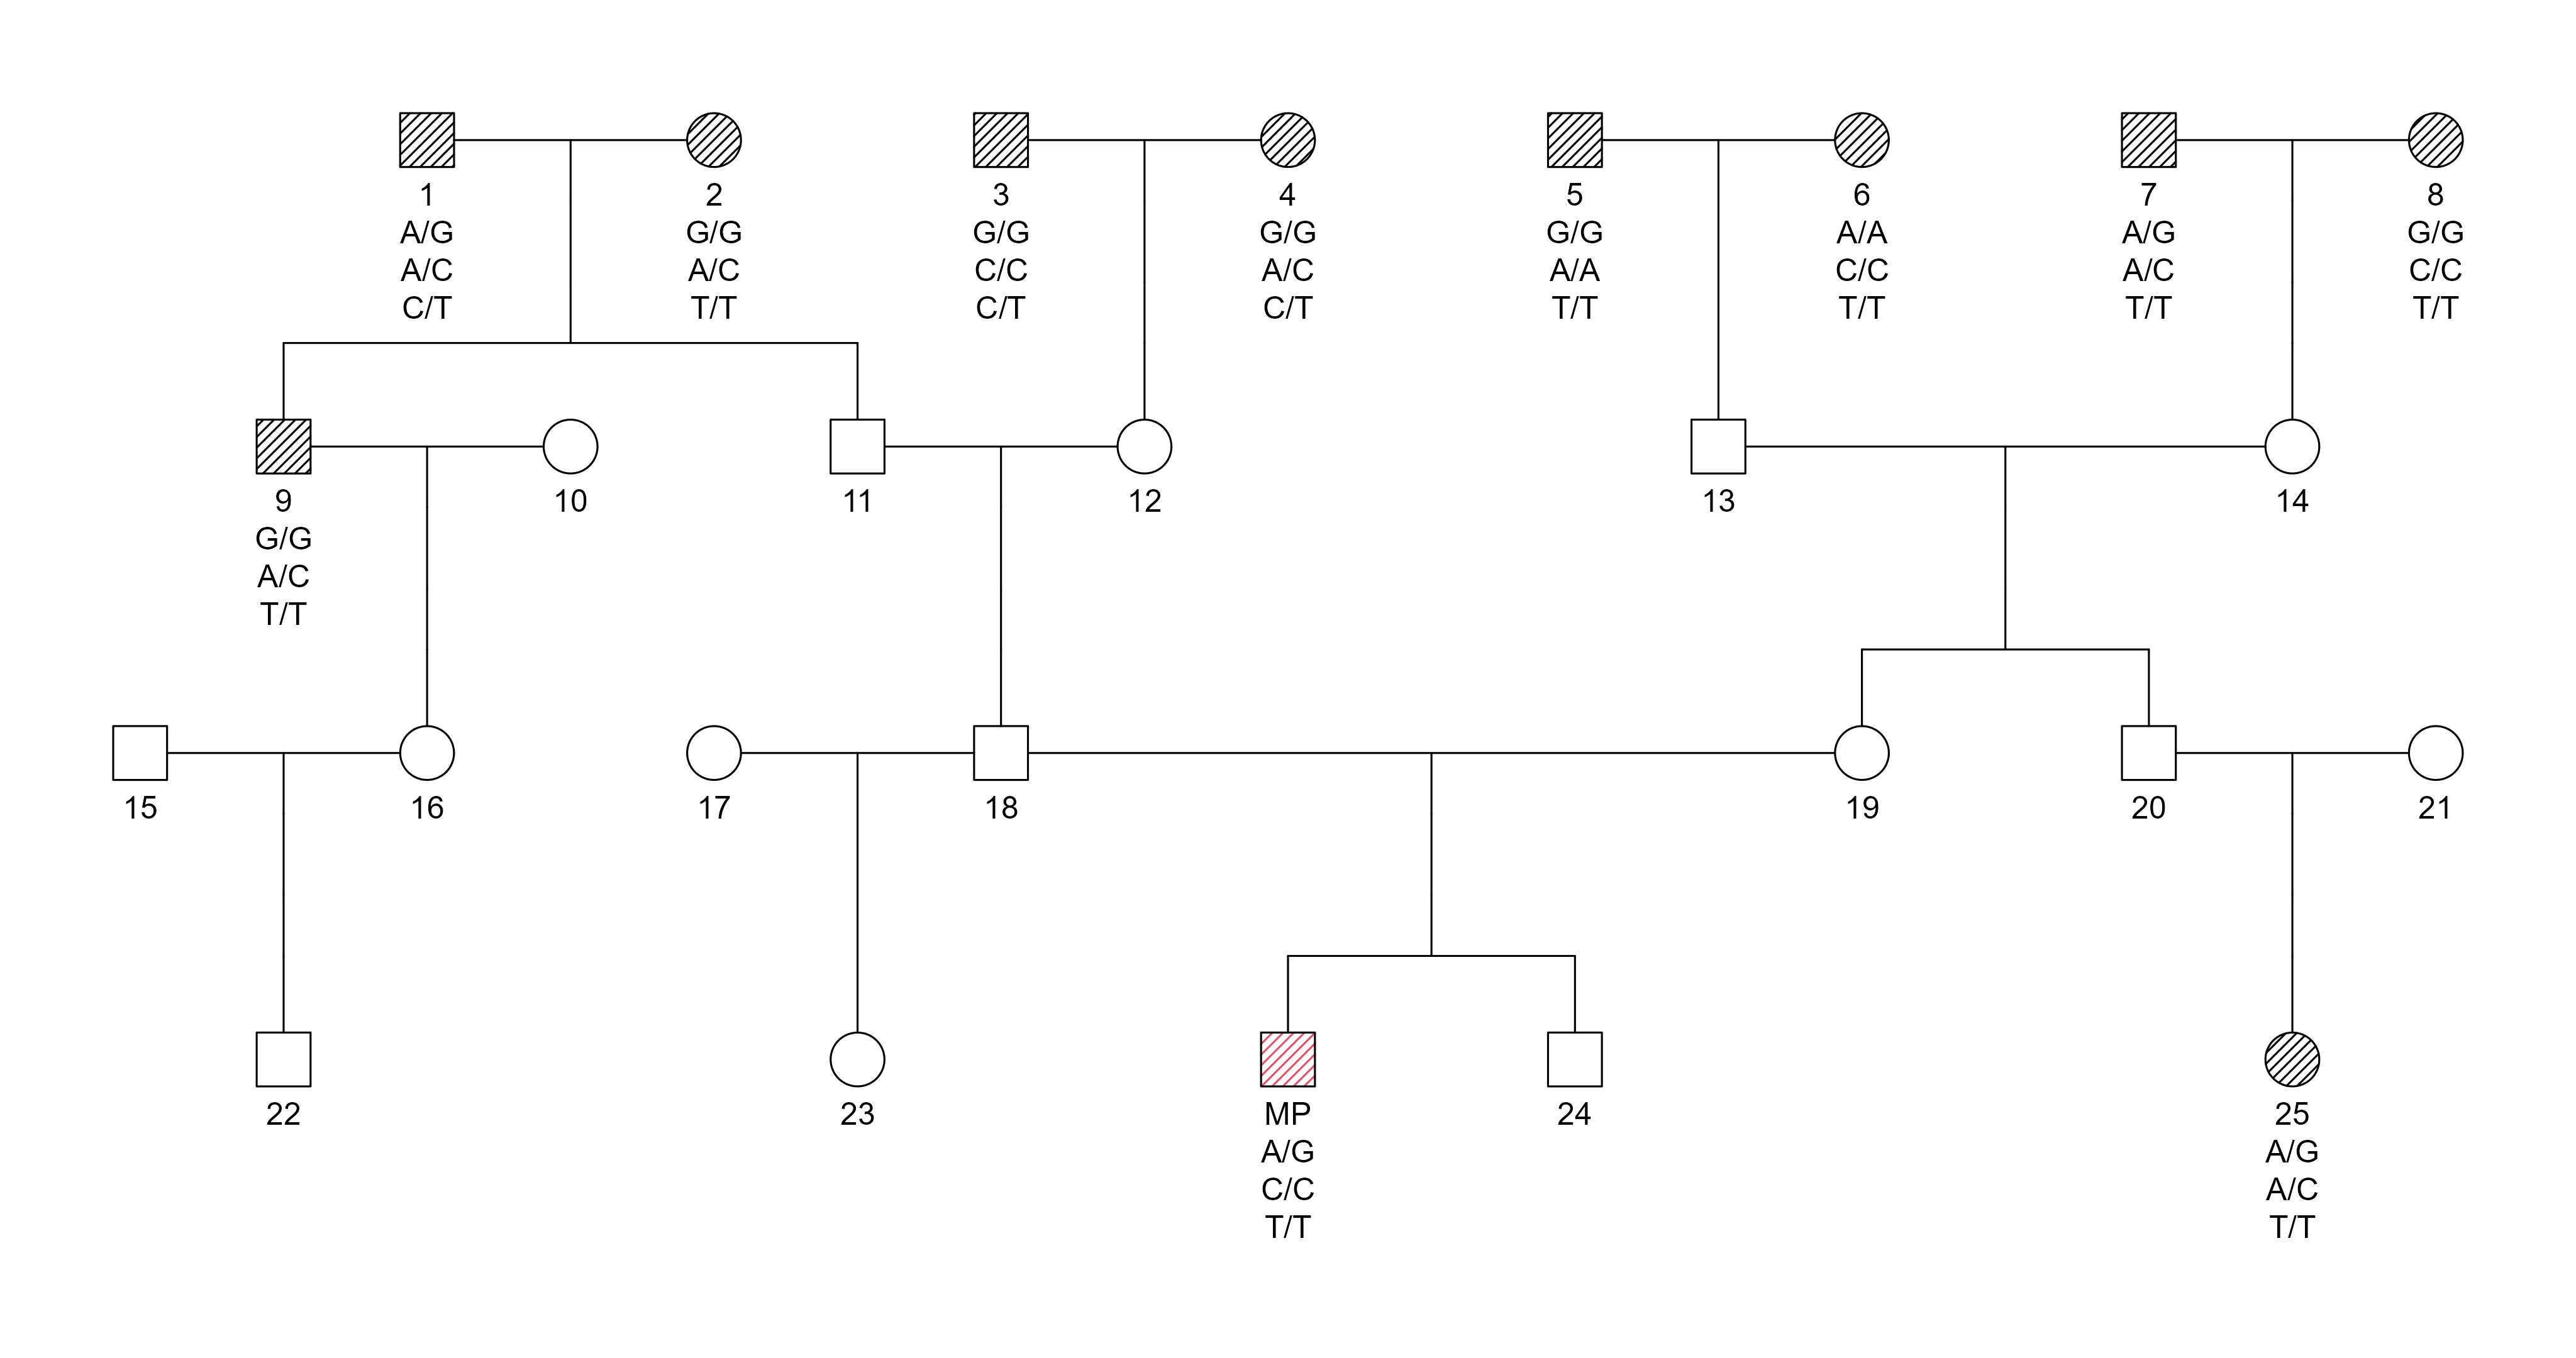
Pedigree structure for SNP-based duo kinship evaluation at the 3rd degree of relatedness. Only the MP and one extended relative are genotyped.
LR distributions:
Interactive LR curves generated from duo kinship simulations using the FORCE 3,915 markers SNP panel . Linked LR computed with Merlin and visualization rendered with Plotly in R.
Third-degree relatives share less DNA, but the 3915-SNP panel retains strong resolution.
The related curve shifts left compared with earlier degrees, yet remains clearly separated from the unrelated distribution, without overlap.
Dense SNP panels still perform extremely well at this level.
👪 4° Degree – First cousins once removed
Pedigree: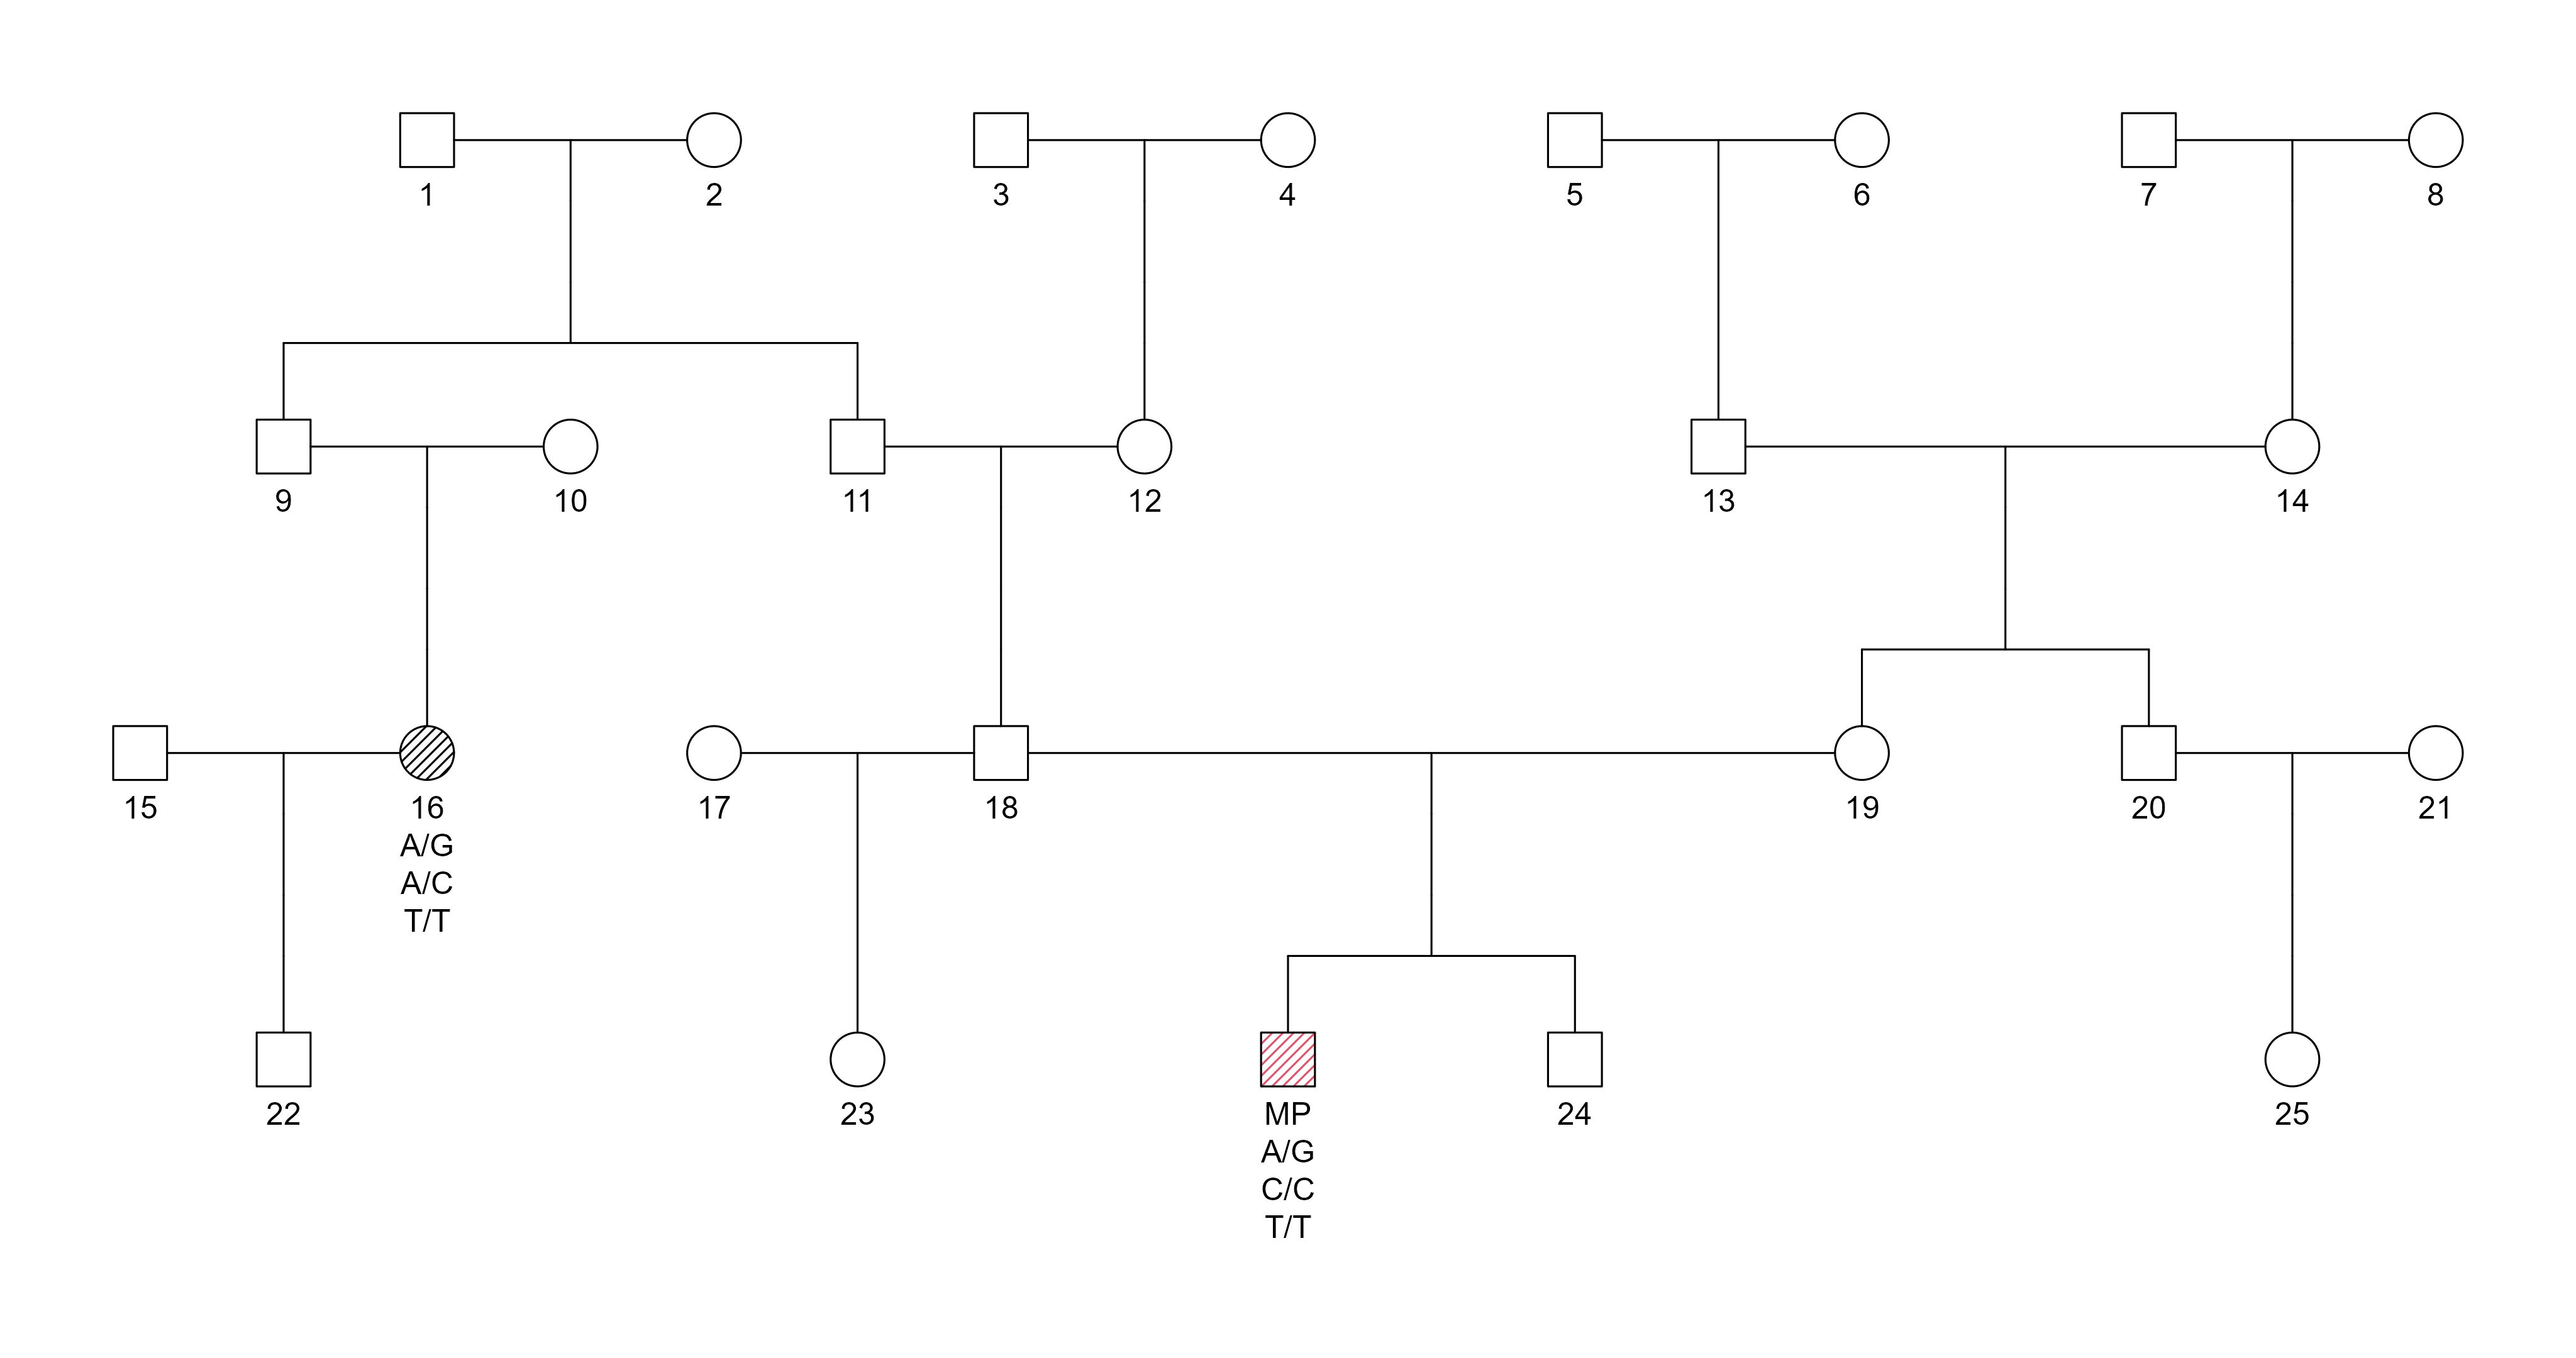
Pedigree representation for SNP-based duo testing at the 4th degree of relatedness. The MP is typed together with first cousin once removed.
LR distributions:
Interactive LR curves generated from duo kinship simulations using the FORCE 3,915 markers SNP panel . Linked LR computed with Merlin and visualization rendered with Plotly in R.
At fourth degree, we begin to see overlap between the tails of the two distributions.
The Related curve moves closer to the zero threshold, and its lower tail overlaps slightly with the upper tail of the Unrelated distribution.
This marks the point where duo-only comparisons begin to lose significant discriminatory power.
However, if additional relatives were included -even a single extra related of the MP-, the likelihood would accumulate more genetic data, moving the Related curve rightward and restoring a clean separation.
🧑🤝🧑 5° Degree – Second cousins
Pedigree: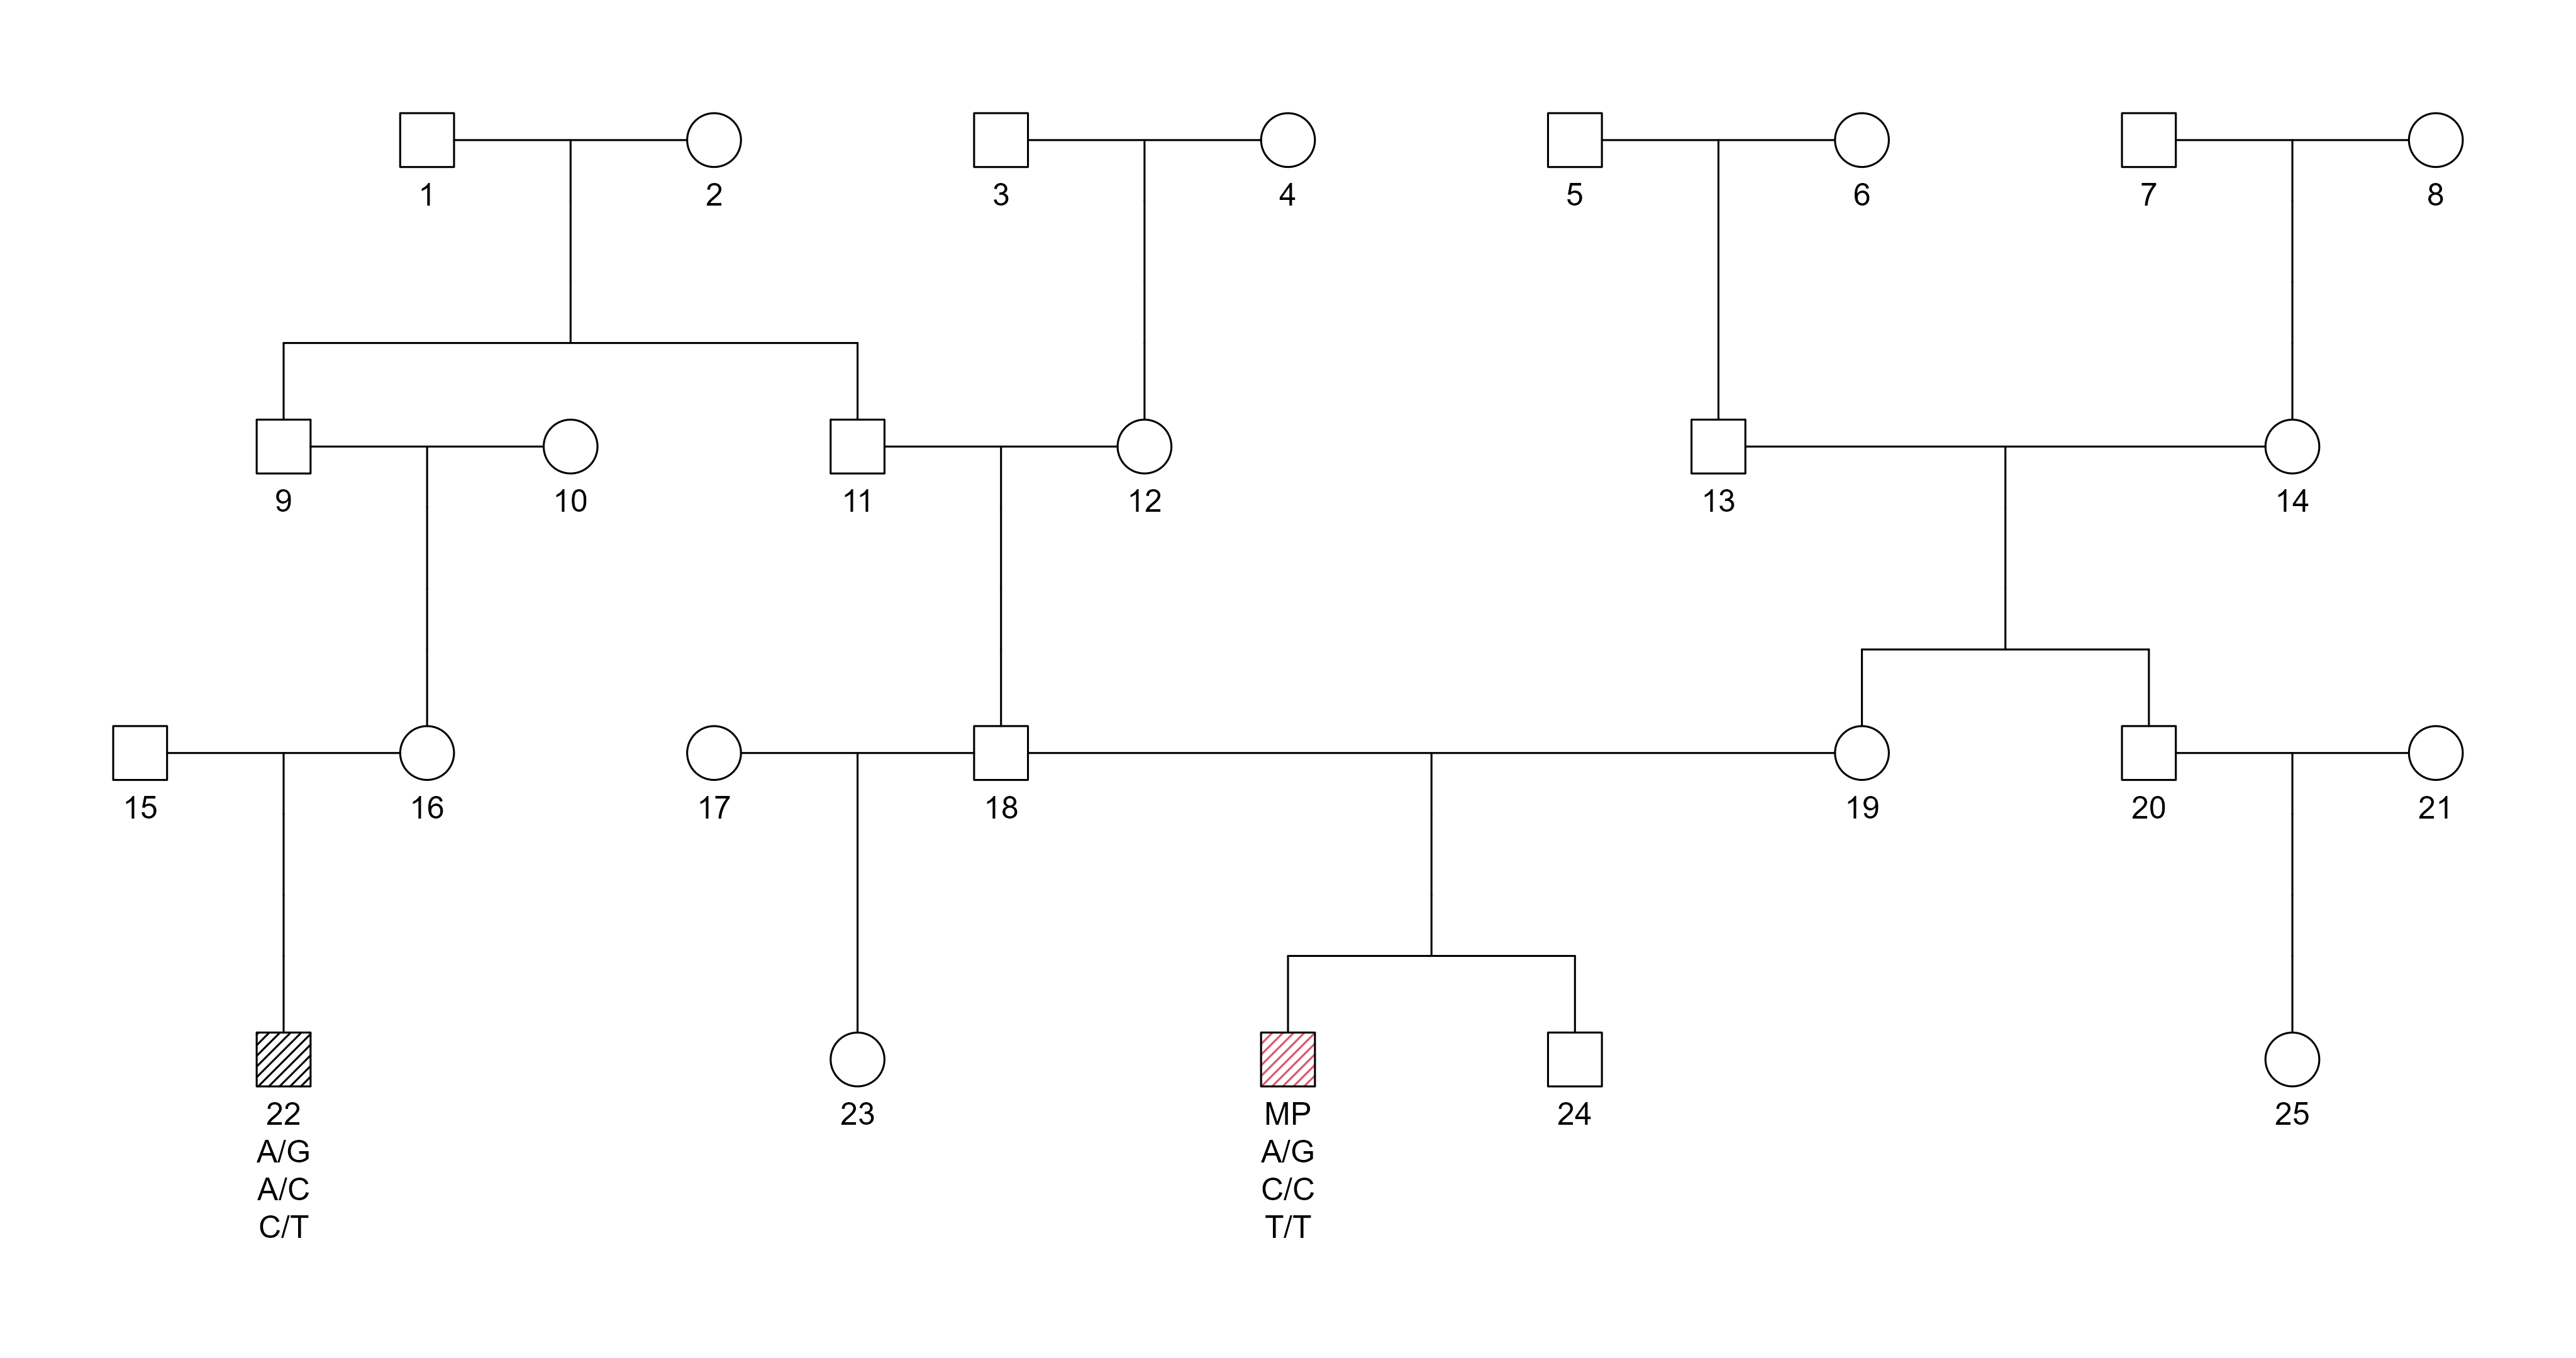
Pedigree diagram for SNP-based duo inference at the 5th degree of relatedness. The MP and a second cousin are compared.
LR distributions:
Interactive LR curves generated from duo kinship simulations using the FORCE 3,915 markers SNP panel . Linked LR computed with Merlin and visualization rendered with Plotly in R.
Fifth-degree relationships show notable overlap between distributions in a duo scenario.
The proportion of shared DNA becomes small, and the variance in IBD sharing increases at distant relationships.
Despite this, the Related curve still tends toward LR values above zero, reflecting real genetic relatedness.
But again, including additional relatives would add more inheritance constraints and almost certainly separate the curves enough to support a strong conclusion of relatedness.
Interpretation note:
In SNP-based likelihood ratio distributions, the Unrelated curve is typically much narrower, taller, and shifted toward strongly negative $log10(Linked LR)$ values. This reflects the high probability that unrelated individuals share very little identical-by-descent (IBD) material.
In contrast, the Related curve is wider and more flattened. This broader dispersion arises from natural variability in shared genomic segments due to recombination and inheritance processes. As a result, related individuals span a wider range of $log10(Linked LR)$ values.
💡 Concluding Remarks
SNP-based kinship inference provides a significant enhancement in resolution compared to STRs, largely due to the availability of thousands of markers and the ability to model linkage between nearby loci.
- For close and intermediate relatives (1st–3rd degree), SNP panels yield highly decisive LR values, even when only two individuals are available.
- For more distant relatives (4th–5th degree), some overlap emerges in duo comparisons, but the Related distribution still tends to remain distinguishable from the Unrelated one.
- Importantly, if additional relatives were included-moving from duo to trio or more complex pedigrees-the curves would separate further, substantially reducing the observed overlap.
Overall, SNPs enable robust kinship inference well beyond the capacity of STRs, offering reliable statistical power even for challenging or distant biological relationships..
The future of forensic identification lies in the integration of these high-resolution genomic methods with robust statistical frameworks and ethical data control.
📚 References
- Vigeland MD (2021). Pedigree Analysis in R. Academic Press. ISBN 978-0128244302.
- Tillmar, A., Sturk-Andreaggi, K., Daniels-Higginbotham, J., Thomas, J. T., & Marshall, C. (2021). The FORCE Panel: An All-in-One SNP Marker Set for Confirming Investigative Genetic Genealogy Leads and for General Forensic Applications. Genes, 12(12), 1968. https://doi.org/10.3390/genes12121968